The Investor Sentiment - Equity and investments forum for Sri Lankans

Join the forum, it's quick and easy

The Investor Sentiment - Equity and investments forum for Sri Lankans
Would you like to react to this message? Create an account in a few clicks or log in to continue.
Please send an email to contact.lankaninvestor@gmail.com if you face any technical difficulties when posting
Search
Display results as :
Advanced Search
Latest topics
CCS.N0000 ( Ceylon Cold Stores)Wed Mar 20, 2024 11:31 amHawk Eye
When Will It Be Safe To Invest In The Stock Market Again?Wed Apr 19, 2023 6:41 amකිත්සිරි ද සිල්වා
Dividend AnnouncementsWed Apr 12, 2023 5:41 pmකිත්සිරි ද සිල්වා
MAINTENANCE NOTICE / නඩත්තු දැනුම්දීමThu Apr 06, 2023 3:18 pmකිත්සිරි ද සිල්වා
SEYB.N0000 (Seylan Bank PLC)Thu Mar 30, 2023 9:25 amyellow knife
The Korean Way !Wed Mar 29, 2023 7:09 amකිත්සිරි ද සිල්වා
In the Meantime Within Our Shores! Mon Mar 27, 2023 5:51 pmකිත්සිරි ද සිල්වා
What is Known as Dementia?Fri Mar 24, 2023 10:09 amකිත්සිරි ද සිල්වා
SRI LANKA TELECOM PLC (SLTL.N0000)Mon Mar 20, 2023 5:18 pmකිත්සිරි ද සිල්වා
THE LANKA HOSPITALS CORPORATION PLC (LHCL.N0000)Mon Mar 20, 2023 5:10 pmකිත්සිරි ද සිල්වා
Equinox ( වසන්ත විෂුවය ) !Mon Mar 20, 2023 4:28 pmකිත්සිරි ද සිල්වා
COMB.N0000 (Commercial Bank of Ceylon PLC)Sun Mar 19, 2023 4:11 pmකිත්සිරි ද සිල්වා
REXP.N0000 (Richard Pieris Exports PLC)Sun Mar 19, 2023 4:02 pmකිත්සිරි ද සිල්වා
RICH.N0000 (Richard Pieris and Company PLC)Sun Mar 19, 2023 3:53 pmකිත්සිරි ද සිල්වා
Do You Have Computer Vision Syndrome?Sat Mar 18, 2023 7:36 amකිත්සිරි ද සිල්වා
LAXAPANA BATTERIES PLC (LITE.N0000)Thu Mar 16, 2023 11:23 amකිත්සිරි ද සිල්වා
What a Bank Run ?Wed Mar 15, 2023 5:33 pmකිත්සිරි ද සිල්වා
104 Technical trading experiments by HUNTERWed Mar 15, 2023 4:27 pmkatesmith1304
GLAS.N0000 (Piramal Glass Ceylon PLC)Wed Mar 15, 2023 7:45 amකිත්සිරි ද සිල්වා
Cboe Volatility Index Tue Mar 14, 2023 5:32 pmකිත්සිරි ද සිල්වා
AHPL.N0000Sun Mar 12, 2023 4:46 pmකිත්සිරි ද සිල්වා
TJL.N0000 (Tee Jey Lanka PLC.)Sun Mar 12, 2023 4:43 pmකිත්සිරි ද සිල්වා
CTBL.N0000 ( CEYLON TEA BROKERS PLC)Sun Mar 12, 2023 4:41 pmකිත්සිරි ද සිල්වා
COMMERCIAL DEVELOPMENT COMPANY PLC (COMD. N.0000))Fri Mar 10, 2023 4:43 pmyellow knife
Bitcoin and Cryptocurrency Fri Mar 10, 2023 1:47 pmකිත්සිරි ද සිල්වා
CSD.N0000 (Seylan Developments PLC)Fri Mar 10, 2023 10:38 amyellow knife
PLC.N0000 (People's Leasing and Finance PLC) Thu Mar 09, 2023 8:02 amකිත්සිරි ද සිල්වා
Bakery Products ?Wed Mar 08, 2023 5:30 pmකිත්සිරි ද සිල්වා
NTB.N0000 (Nations Trust Bank PLC)Sun Mar 05, 2023 7:24 amකිත්සිරි ද සිල්වා
Going South Sat Mar 04, 2023 10:47 amකිත්සිරි ද සිල්වා
When Seagulls Follow the TrawlerThu Mar 02, 2023 10:22 amකිත්සිරි ද සිල්වා
Re-activatingSat Feb 25, 2023 5:12 pmකිත්සිරි ද සිල්වා
SAMP.N0000 (Sampath Bank PLC)Wed Nov 30, 2022 8:24 amකිත්සිරි ද සිල්වා
APLA.N0000 (ACL Plastics PLC)Fri Nov 18, 2022 7:49 amකිත්සිරි ද සිල්වා
AVOID FALLING INTO ALLURING WEEKEND FAMILY PACKAGES.Wed Nov 16, 2022 9:28 pmකිත්සිරි ද සිල්වා
Banks, Finance & Insurance Sector ChartTue Nov 15, 2022 5:26 pmකිත්සිරි ද සිල්වා
VPEL.N0000 (Vallibel Power Erathna PLC)Sun Nov 13, 2022 12:15 pmකිත්සිරි ද සිල්වා
DEADLY COCKTAIL OF ISLAND MENTALITY AND PARANOID PERSONALITY DISORDER MIX.Mon Nov 07, 2022 6:36 pmකිත්සිරි ද සිල්වා
WATA - WatawalaSat Nov 05, 2022 8:44 amකිත්සිරි ද සිල්වා
KFP.N0000(Keels Food Products PLC)Sat Nov 05, 2022 8:42 amකිත්සිරි ද සිල්වා
Capital Trust Broker in difficulty?Fri Oct 21, 2022 5:25 pmකිත්සිරි ද සිල්වා
IS PIRATING INTELLECTUAL PROPERTY A BOON OR BANE?Thu Oct 20, 2022 10:13 amකිත්සිරි ද සිල්වා
What Industry Would You Choose to Focus?Tue Oct 11, 2022 6:39 pmකිත්සිරි ද සිල්වා
Should I Stick Around, or Should I Follow Others' Lead?Tue Oct 11, 2022 9:07 amකිත්සිරි ද සිල්වා
DV-2024 Program: Online RegistrationThu Oct 06, 2022 11:26 amකිත්සිරි ද සිල්වා
Disclaimer


Information posted in this forum are entirely of the respective members' personal views. The views posted on this open online forum of contributors do not constitute a recommendation buy or sell. The site nor the connected parties will be responsible for the posts posted on the forum and will take best possible action to remove any unlawful or inappropriate posts.
All rights to articles of value authored by members posted on the forum belong to the respective authors. Re-using without the consent of the authors is prohibited. Due credit with links to original source should be given when quoting content from the forum.
This is an educational portal and not one that gives recommendations. Please obtain investment advises from a Registered Investment Advisor through a stock broker

Trading Journal

+22
Topcat
sanjulanka
lanka
PANTOMATH
Brave Heart
nihal123
serene
First Guy
007
yellow knife
කිත්සිරි ද සිල්වා
roshana7549
blacknights
Future123
jack18
Axe
Backstage
CK
slstock
pathfinder
Yin-Yang
xmart
26 posters
Go down
xmart
xmart
Top contributor
Top contributor
Posts : 732
Join date : 2015-01-17

Trading Journal  Empty Trading Journal

Wed Jun 22, 2016 8:35 pm
Message reputation : 100% (5 votes)
Hello Tech Pals,

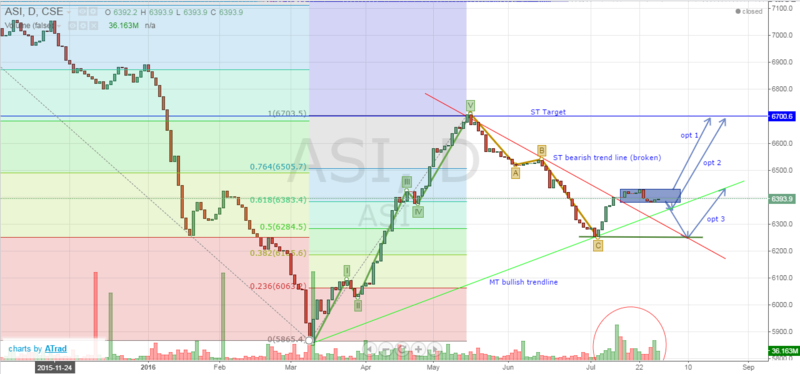
Some times back NC started a trading journal for himself. I found the practice useful to identify tech setups, performance and personalities of stocks with ASI. therefore, i am initiating this thread to discuss tech prospective of any share (better to mention whether its backed up by fundamentals)

I am not a guru but a curios soul trying to find out waves and rhythm of the market. no one should take any particular set up of trend as a buy/ sell recommendations. be kind enough to do your own studies before execute any order.

good luck all
xmart
xmart
Top contributor
Top contributor
Posts : 732
Join date : 2015-01-17

Trading Journal  Empty Re: Trading Journal

Wed Jun 22, 2016 8:53 pm
Message reputation : 100% (7 votes)
JKH.N0000

Trading Journal  Jkh10

After bottomed out at 140 JKH is making a higher low. 10 MA cross above 20 MA while MACD give bullish crossover. JKH is being accumulated though the price remained unchanged.

3 major Elliot waves were finished. are we looking at new wave forming or a retraccement?

anyway, my reading says JKH should reach 185 before forming a new trend either down or up.

any thoughts?
Yin-Yang
Yin-Yang
Posts : 1321
Join date : 2016-03-12

Trading Journal  Empty Re: Trading Journal

Wed Jun 22, 2016 10:50 pm
Message reputation : 100% (3 votes)
My gut feelings says...
buy at 150 and sell at 165 and be satisfied with it.

දැනට වේලිච්ච කොටි මස් කාපල්ලා. නරියා අමු මස් ගෙනෙයි.
pathfinder
pathfinder
Top contributor
Top contributor
Posts : 1450
Join date : 2014-02-23

Trading Journal  Empty Re: Trading Journal

Thu Jun 23, 2016 7:45 pm
Message reputation : 100% (4 votes)
X-mart JKH still hasn't form a bottom,so taking it as higher low is not acceptable,Anyway it's being collected.
xmart
xmart
Top contributor
Top contributor
Posts : 732
Join date : 2015-01-17

Trading Journal  Empty Re: Trading Journal

Thu Jun 23, 2016 8:26 pm
Message reputation : 100% (2 votes)
Path, Agree on that higher low. still the leg has not fully formed. together with rest of indicators i made a bold judgment.

as YY said, i do hope 150 would hold (for everyone's sake) if bounced at 150 then immediate resistance will be at 160-165. in that sense YY correct as per the prevailing market condition much cannot be expected.

since i have used 1 week chart here and major 5 waves were finished there should be a correction. it can either be flat, zig zag or upward. if downtrend to presume ASI should break 6000 mark again (which is not a good sign).

thanks guys!
slstock
slstock
Veteran
Veteran
Posts : 6216
Join date : 2014-06-12

Trading Journal  Empty Re: Trading Journal

Fri Jun 24, 2016 6:06 am
Message reputation : 100% (5 votes)
Good initiative.

I think,

best to wait till the jkh split is done so you can revisit the trend.
xmart
xmart
Top contributor
Top contributor
Posts : 732
Join date : 2015-01-17

Trading Journal  Empty Re: Trading Journal

Mon Jul 11, 2016 11:13 am
Message reputation : 100% (8 votes)
thanks all. lets look at ASI daily

Trading Journal  Captur11

at 6380- 6400 we are facing a down trend line resistance. this is a crucial hour to decide the direction of the ASI in coming days.

if we break 6300 again, it will violate the medium term up trend line. still 6250 would give a strong support. 6250 to 6450 there would be ranging action as per my reading. again i may be wrong!

technically breaking above 6440 would give a sign of a new up trend.
CK
CK
Active Member
Active Member
Posts : 1393
Join date : 2015-11-01

Trading Journal  Empty Re: Trading Journal

Mon Jul 11, 2016 11:47 am
Message reputation : 100% (3 votes)
Thanks xmart. please keep updating this link.
Backstage
Backstage
Top contributor
Top contributor
Posts : 3803
Join date : 2014-02-24

Trading Journal  Empty Re: Trading Journal

Mon Jul 11, 2016 12:30 pm
Message reputation : 100% (2 votes)
CK wrote:Thanks xmart. please keep updating this link.

yes yes yes...
Axe
Axe
Posts : 251
Join date : 2014-02-23

Trading Journal  Empty Re: Trading Journal

Thu Jul 14, 2016 2:51 pm
Hi Xmart, Thanks for the previous updates..

Now that ASI is above 6400 what is you expectation of its value in the coming weeks?
Yin-Yang
Yin-Yang
Posts : 1321
Join date : 2016-03-12

Trading Journal  Empty Re: Trading Journal

Thu Jul 14, 2016 5:04 pm
Message reputation : 100% (6 votes)
On a serious note:
This thread appears to be getting better.

Just sharing my random feeling on market's mentality.

Referring to xm's picture,
I feel, if this is going to be an uptrend in medium scale, the rise should be much steeper than the drawn line. I would say, if this is going to be an uptrend we should witness ASI near 6800 within this month.

Otherwise, market will range at least for another 3 more months.

A slower rise will never make it above 6800.


As said somewhere else;

To pull out a deep shit stuck elephant, we need an equal or a bigger jumbo.
xmart
xmart
Top contributor
Top contributor
Posts : 732
Join date : 2015-01-17

Trading Journal  Empty Re: Trading Journal

Mon Jul 18, 2016 8:53 pm
Message reputation : 100% (3 votes)
thanks all,

ASI is hovering around 6400-6420. breaking above 6440 with a volume support may fuel next big move up. but upward momentum is getting reduced it seems. ASI may consolidate just below 6400 and break above or retreat to 6300 max and will test the resistance at 6440-6450.

will see the chart at end of july. good luck all!
xmart
xmart
Top contributor
Top contributor
Posts : 732
Join date : 2015-01-17

Trading Journal  Empty Re: Trading Journal

Mon Aug 01, 2016 10:22 pm
Message reputation : 100% (6 votes)
hi all, its 1st of Aug and lets look at the chart

Trading Journal  Captur12

the good news is ASI breaks the short term resistance trendline and ranging between 6380-6420. looking at the volume this is a healthy consolidation to the next level. the next resistance level would be near term high 6680-6700. which is 50% fib of the great fall. therefore, this resistance would be hard to break.

anyway, if ASI to stay in positive territory it should break the rectangle and move up. there are few options at that stage

option 1: follow by the rectangular consolidation (which is a reliable continuation pattern) ASI should go up. 6500 would be a challenge but there should not be much resistance. (ref date by 20/8/2016)

option 2: if PM gave a shock with his policy decisions market will react negatively and break the rectangle down, but panic selling would find buyers around 6350-6380 and start the journey to test 6680 level. (ref date by 27/8/2016)

option 3: PM gave a big shot with unexpected capital gain, unfavorable economic policy, another world turmoil would bring ASI to 6250. which is unlikely but cannot rued out.

therefore, shall we expect something exciting around end of august?

good luck
CK
CK
Active Member
Active Member
Posts : 1393
Join date : 2015-11-01

Trading Journal  Empty Re: Trading Journal

Tue Aug 02, 2016 6:06 am
Message reputation : 100% (1 vote)
thanks X.
xmart
xmart
Top contributor
Top contributor
Posts : 732
Join date : 2015-01-17

Trading Journal  Empty Re: Trading Journal

Wed Aug 10, 2016 8:18 pm
Message reputation : 100% (2 votes)
so far so good. we got confirmed signals for option 01. are we looking at 6700 at end of the month? bounce
Axe
Axe
Posts : 251
Join date : 2014-02-23

Trading Journal  Empty Re: Trading Journal

Thu Aug 25, 2016 3:32 pm
Message reputation : 100% (2 votes)
Guys I was looking at a few chart patterns lately and was keen on ACME chart formation.

It looks like the weekly chart has broken a resistance of 7.70 with this week's trading with some considerable volume. It looks like an ascending triangle pattern. Just wanted to let you guys know. I am not good with charts so better to confirm yourselves..

I cannot seem to put a picture up here but when I can I will, may be later tonight.
Axe
Axe
Posts : 251
Join date : 2014-02-23

Trading Journal  Empty Re: Trading Journal

Thu Aug 25, 2016 9:36 pm
Message reputation : 100% (1 vote)
Here is my chart... Let me know if you agree..

Trading Journal  Acme_210
xmart
xmart
Top contributor
Top contributor
Posts : 732
Join date : 2015-01-17

Trading Journal  Empty Re: Trading Journal

Thu Aug 25, 2016 10:56 pm
Message reputation : 100% (3 votes)
axe,

still the pattern is too early to be ascending triangle. this could take many forms. the good news is ACME had come out from MT resistance trend. making that "W" with a higher low after a downtrend is a good reversal point.

there is a big resistance at 8.80-9.00 range. breaking above 8 will trigger the target of 8.80-9.00 range. furthermore, each stock has its unique way. if you carefully look at weekly candlestick chart you may see dojis at start and end point of each rally.

CCI gave a buy signal at 7.60-7.80 level (22.08.2016) after 28.04.2014. which cannot be ignored very easily (for me)

on financial note:
this is still a loss making company. they went through a restructuring process, change management and reduced loss very well. if they produce a positive earning this will appreciate more. if they fail to return 'from loss making territory, then this technical rally might not sustained and may return to 6.5 level.

good luck.

P:S- i have collected this share from 6 to 6.60 averaging 6.20. my view might be bias but tried to give a balance view.
Axe
Axe
Posts : 251
Join date : 2014-02-23

Trading Journal  Empty Re: Trading Journal

Thu Aug 25, 2016 11:42 pm
Message reputation : 100% (1 vote)
Thanks xmart for your input...

I assume you are referring to Commodity Channel Index, am I correct? One question there, so there seems to be a lot of indicators available for tech traders, how would you select the most suited one?

Thanks for pointing out the doji patterns..

Good luck to you too.
xmart
xmart
Top contributor
Top contributor
Posts : 732
Join date : 2015-01-17

Trading Journal  Empty Re: Trading Journal

Thu Sep 01, 2016 10:37 pm
Message reputation : 100% (6 votes)
xmart wrote:JKH.N0000

Trading Journal  Jkh10

After bottomed out at 140 JKH is making a higher low. 10 MA cross above 20 MA while MACD give bullish crossover. JKH is being accumulated though the price remained unchanged.

3 major Elliot waves were finished. are we looking at new wave forming or a retraccement?

anyway, my reading says JKH should reach 185 before forming a new trend either down or up.

any thoughts?

JKH rejected at 158-160 region (pre-split 182). i exited at 158 with 14% gain for short term. looks like its trying to consolidate around 150 before the conversion. looking at past price actions, after warrant conversion we may see a drop in share price and settle at 140-144 level before its real run. there is a big resistance at 165 level and i believe JKH need more fuel to break 165, 170 and then show its true colors. JKH will be a share for 2017-2018.

xmart wrote:hi all, its 1st of Aug and lets look at the chart

Trading Journal  Captur12

the good news is ASI breaks the short term resistance trendline and ranging between 6380-6420. looking at the volume this is a healthy consolidation to the next level. the next resistance level would be near term high 6680-6700. which is 50% fib of the great fall. therefore, this resistance would be hard to break.

anyway, if ASI to stay in positive territory it should break the rectangle and move up. there are few options at that stage

option 1: follow by the rectangular consolidation (which is a reliable continuation pattern) ASI should go up. 6500 would be a challenge but there should not be much resistance. (ref date by 20/8/2016)

option 2: if PM gave a shock with his policy decisions market will react negatively and break the rectangle down, but panic selling would find buyers around 6350-6380 and start the journey to test 6680 level. (ref date by 27/8/2016)

option 3: PM gave a big shot with unexpected capital gain, unfavorable economic policy, another world turmoil  would bring ASI to 6250. which is unlikely but cannot rued out.

therefore, shall we expect something exciting around end of august?

good luck

we have cleared for opt 01 and cleared 6500 and rejected at 6600 with month end and profit taking. i think it is most welcome pullback and much needed retracement to collect strength to break 6700, which recent high and will give a good fight to the bull. hey, its September and we can expect market to break its recent high and clear the path to 6850, 7000 marks in coming months. with the market everything may go up but only few will outperform the market.

lets look at the chart.

Trading Journal  Asi_9_10

we may expect MT support to hold for now. 6680-6700 will provide some good fight for bull (0.5 fib) and it is essential ASI to break above 6700 to stay in bull trend. if rejected 6400, 6250 will provide some support, but highly unlikely with given market sentiment and September results. in a nutshell, i am expecting a super September.

good luck all!
avatar
jack18
Posts : 58
Join date : 2015-05-19

Trading Journal  Empty Re: Trading Journal

Thu Sep 01, 2016 10:43 pm
Message reputation : 100% (1 vote)
Thank you Xmart for the detailed analysis
xmart
xmart
Top contributor
Top contributor
Posts : 732
Join date : 2015-01-17

Trading Journal  Empty Re: Trading Journal

Thu Sep 01, 2016 10:47 pm
Message reputation : 100% (3 votes)
Axe wrote:Thanks xmart for your input...

I assume you are referring to Commodity Channel Index, am I correct? One question there, so there seems to be a lot of indicators available for tech traders, how would you select the most suited one?

Thanks for pointing out the doji patterns..  

Good luck to you too.

axe,

sorry for delay in reply.

well, yes there are lot of indicators and one should not messing around with too many of them, which will spoil the soup and give the cook a real headache.

resistance, supports and price action are all based on crowd sentiment. there are some good indicators to back up your observations. one should play around and mater his eyes to see what really market is showing not what really you want to see. apart from RSI and MACD followings are useful and powerful indicators to help you to judge the market.

1. ADX
2. CCI
3. Stochastic RSI
4. William Alligator, Awesome oscillator
5. Accumulation/ Distribution

cheer!
avatar
Future123
Active Member
Active Member
Posts : 1435
Join date : 2014-04-09

Trading Journal  Empty Re: Trading Journal

Fri Sep 02, 2016 12:06 am
Message reputation : 100% (1 vote)
Thanks Xmart
blacknights
blacknights
Posts : 267
Join date : 2014-08-28

Trading Journal  Empty Re: Trading Journal

Fri Sep 02, 2016 1:05 am
Message reputation : 100% (1 vote)
Thanks Xmart. As always great yet simple tech analysis.
avatar
roshana7549
Posts : 280
Join date : 2014-04-18

Trading Journal  Empty Re: Trading Journal

Fri Sep 02, 2016 7:05 am
Message reputation : 100% (1 vote)
Thanks Xmart for your Tech presentation.....
Back to top
Permissions in this forum:
You cannot reply to topics in this forum